Friday, September 30, 2016

Baad riting distroy's produktiviti via @HarvardBiz #93

There is an interesting article in the Harvard Business Review this month by Josh Bernoff: "Bad Writing Is Destroying Your Company’s Productivity". The article starts with:

A hidden source of friction is slowing your company down. Your workers are complicit in it. So is your management. And it’s driving everybody nuts.

It’s bad business writing.

Car park sign at Cambridge University.
Image source: The Telegraph.
I couldn't agree more. I work in an academic institution so thankfully "bad business writing" is rare, but none of us is perfect (or is it "are perfect"?). Recently at a meeting, I got up on my high horse and moaned about the misspelling of names on a list of names. I hate it when someone spells my name wrong - often the apostrophe is left out. I have taken in the recent past to add fadas to Irish names such as Seán, Oisín, and Sinéad - it's only one extra keypress on the keyboard and the effort involved is minuscule. To me if you take your business seriously, it is not a tough ask to get a person's name right, and by extension other words too.

Josh Bernoff gives us the following points to consider...
  • Vague writing dilutes leadership
  • Clarity in marketing tells customers — and workers — that they can trust you
  • Fuzzy writing allows fuzzy thinking
  • A culture of clear writing makes managers more productive

...and he gives excellent examples from Yahoo, Apple, and Google to prove his points. He begs us to "clear all the crap out of your inboxes", and to commit to a "culture of clarity". Apart from improving productivity in a business, it makes life a lot less annoying. 

Thursday, September 29, 2016

Interesting Trends about Book Sales from The Association of American Publishers via @AmericanPublish #94

Sales of eBooks are in decline according to recent data published by The Association of American Publishers (AAP) for March 2016 - down 21.8% year-over-year. Hardback book sales also declined (by 8.5%), while paperbacks grew by 6.1%. What's interesting is the audio book sales increased by a huge 35.3% over the same period. Does this represent a shift from reading to listening?

Certainly I would have expected eBook sales to be increasing rather than decreasing - especially given that they tend to be a lot cheaper than paper versions and that they are easy to read on Kindles. But as I wrote in blog post #128, "Sales of ebooks are not rising fast enough to match the decline of printed textbooks", so there seems to be a trend of decline in ebook sales that has publishers worried. However, it could be now that audio books sales can compensate instead. 

Image source: Jackie Lea Sommers.
Blogger and author Jackie Lea Sommers puts it nicely when she writes why she thinks that audiobooks are sometimes better: "Audiobooks have been a huge blessing in my life; they entertain me on long car rides, distract me from my OCD, help me fall asleep at night, and make mundane things (like driving, cleaning, etc.) worthwhile because I’m engaging my mind". She, like others, prefers audio version to paper. 

Last year I listened to the incredibly popular Serial Podcast series about the conviction of Adnan Syed for the murder of Hae Min Lee. Essentially it was like an audio book, except it is not published as a book. I have never bought or listened to a real audio book, but I think I'll give it a try. 

Wednesday, September 28, 2016

Two New Videos for SPSS #Analytics #Statistics #HDSDA #95

I have been using IBM's SPSS in my Statistics classes for the past three years, but until now I have never created any videos for this tool. YouTube already has several videos on how to do stuff in SPSS, but I've decided to add to these to create study and revision aids for my own students.

The first video, "How To... Calculate the Mean, Median, and Mode in SPSS", is a fairly short and simple exercise to calculate three average measures of central tendency: mean, median, and mode. I use a small sample of 25 values (test scores) and walk through step-by-step how to use SPSS to calculate and output these descriptive statistics:


In the second video, How To... Calculate Measures of Variability (Range, Variance, and Standard Deviation) in SPSS, I show how to determine measures of variability using the range, variance, and standard deviation statistics. This time I am using 30 values - the test is also straightforward to do and I walk the learner through this step-by-step:


My expectations for getting high numbers of views for these videos are low. Others that I've seen on YouTube do not have the high Views figures that Excel videos seem to get. Nevertheless, I hope they are useful to my own students - and many others out there in YouTube land.

Tuesday, September 27, 2016

Comparing Counties and Regions of Ireland: Men vs Women who have a Degree or Professional Qualification #Analytics #HDSDA #96

Following yesterday's post about the number of degrees per region in Ireland, more interesting comparisons can be made when you compare the numbers of men and women with honours degrees (or a professional qualification). The Small Area Population Statistics (SAPS)) divides the Republic of Ireland into 34 areas and also provides the numbers of people in each area who have a degree as their highest qualification. The data are broken down for men and women and I have used Tableau Software below to plot a clustered bar chart of the percentage of both for each area (the figures are for all adults only aged 18 and over):

Click image to enlarge.

Some interesting facts emerge. In every area except Dún Laoghaire-Rathdown (DLR), there are more women than men with a degree or professional qualification. A whopping 15.8% of men have this level of education in DLR - the highest in the country, compared to 13.4% of women (the second highest in the country). The lowest figure for men is 4.3% in Offaly, and for women it is 5.7% in Limerick City. In the major urban areas (eg DLR, Fingal, Dublin City, Galway City, and Cork) the difference between men and women is not nearly as marked as it is in rural areas. The biggest gap is 3.3% in Monaghan, where the figure for women is 7.6% and the figure for men is 4.4% (figures rounded). 

These data contrast sharply with the percentage of the population in each county for the number of men and women with a PhD. In almost every county, the number of men with a PhD exceeded the number of women, while the reverse is the case above for honours degrees. The obvious conclusion here is that far more men than women go on to postgraduate study. Note that there is no age breakdown provided in SAPS for qualifications - I suspect that the number of degrees is much higher for people under 50 than over this age. 

Similar statistics for the 2016 Census are due to be published in March 2017, and it will be interesting to make comparisons with above data. We should see a slight increase in numbers, but by how much and will it be across all counties and areas?

Monday, September 26, 2016

How do Counties and Regions in Ireland Compare for Number of Degrees? #Analytics #HDSDA #97

Last week I noticed a jump (4 times normal) in the number of views on this blog when I posted about "Which is the smartest county in Ireland?" - I compared the 26 counties for total number of PhDs, and followed up the next day with a breakdown for men and women. It was interesting to note the wide discrepancies between the counties with high numbers of PhDs and low numbers. Today I'm taking a quick look at some more Small Area Populations Statistics (SAPS) from the Central Statistics Office (2011 Census).

The data are downloaded in CSV format from SAPS and the data I am examining relates to the number of people in each of the 34 areas with "Honours Bachelor Degree, Professional Qualification (or both)" as the highest level of education achieved. I am only using data for adults (18 or over). I used Excel to convert that actual numbers in each area into a percentage of the adult population within each area to make for more useful comparisons. Below is a bar plot (drawn using R) comparing each of the 34 areas given in the SAPS data:

Click on image to enlarge.

You can already see that there is a less dramatic difference between areas than for doctorate degrees. Dún Laoghaire-Rathdown comes out the highest with 14.5% of the adult population having a degree or professional qualification. Galway city, Fingal, and Dublin City are next on around 10% each, with surprisingly (to me) South Dublin lagging behind on 8%. County Offaly is the county with the lowest number of percentage degrees on 5.5%. Despite the presence of the University of Limerick and Limerick IT, Limerick City has the second lowest proportion of degrees at 5.7% - interestingly Limerick county is on 7.7%. As with the PhD data, counties and areas where there are no Colleges (with the exception of Limerick) tend to have a lower proportion of their populations having a degree or professional qualification. 

I don't think we can read into these data that there is an educational divide between rural and urban areas. Urban areas are where the jobs are for people with degrees, so I'm guessing that the differences are due as much to this rather than there are (for example) less Offaly people with a degree than other areas. 

Tomorrow I'll take a look at comparing men and women in each area.

Sunday, September 25, 2016

Two Pints #98

A real pleasure today to bring my Dad Joe to the local (The Wishing Well) for a pint. He does not come to Dublin that often these days - normally it is usually me going down to Carnew or Kildavin to have a pint with him. We both like our Guinness and I thought that a photo of the two of us would look great on my blog for today's post. We had a great chat about family, and as always Dad is great company and full of good cheer. 


Earlier we had been to see my Mum Phil in the Hermitage Clinic where she is recovering very well from a knee operation. Here we were also talking about family and she mentioned that her grandmother Margaret (Coburn) Byrne was a Protestant. Nothing at all wrong with that of course, but I never knew I was one eight "Protestant", having always assumed that all my ancestors were Catholic. Something to add to my family tree!

Saturday, September 24, 2016

The Demographic Divide in the Irish Workplace via @aon_plc #AnotherReminderOfMyAge #99

Aon has produced an interesting infographic comparing Baby Boomers, Generation X, Millenials, and Generation Z. I was born in 1959, so I guess that this makes me a Baby Boomer - these are generally classified as people who were born in the years after the Second World War. In 2010, Baby Boomers started to reach retirement age (in countries where 65 is the retirement age) - I am due to retire in 2026 at the age of 67. While a graphic like this is a reminder of my age, it also gives an interesting insight into the structure of our workforce in Ireland as the Baby Boomers are slowly disappearing, while bubble passes on to the Generation X'ers and Millenials. It will seem like in no time at all that Baby Boomers will not be on an infographic like this in the future.

Click image to enlarge.
Image source: Aon.
Note the "Communication preferences". It says Baby Boomers prefer to use "face to face", "telephone", and "increasingly email". I have been using email since 1995 on almost a daily basis since I got my first Ireland On-line account. I'm not sure that I agree with this statement about Baby Boomers, but then again I was born right at the end of this generation. I can't imagine that there are many office workers in Ireland between the ages of 57 and 67 that do not use email. Interestingly, the Generation Z preference is for instant messaging apps and social media - not a sign of face to face, telephone, or email. The business world will have to prepare for this and I'm certain that a lot of business opportunities will be created for new types of communication by some clever Millenials and Z'ers.

Even though I am technically part of the Baby Boomer generation, I feel more in tune with Generation X. I am very much a digital immigrant - I told students in a class on Tuesday that it was around 1984 (at the age of 35) when I touched a computer for the first time. So I did not grow up with computers, and only started to use them when I was doing postgraduate studies in Trinity from 1984 to 1987. I was lucky to get work (in CBT Systems in 1989) at a time when the IT industry was only getting off the ground in Ireland. I'd love to be alive in 100 years time to see what a 2116 version of this infographic would look like.

Friday, September 23, 2016

A Comparison of Males and Females with a Ph.D. by County in Ireland #Analytics #HDSDA #100

Yesterday I showed a chart detailing how the counties of Ireland differ in the number of people resident in each county who hold a Ph.D. by percentage. Today I want to compare the gender balance/imbalance in each county. 

Again I downloaded the data from the 2011 Census Small Area Population Statistics (SAPS) and this time I used Excel to provide a clustered bar chart of males and females for each county. The numbers of men and women with Ph.D. in each county is provided in the data set (along with county population for males and females), but I converted this to a percentage in order to make more balanced and valuable comparisons. These figures are for males and females over the age of 19 only. Here's the chart drawn in Excel:


Click image to enlarge.
In many counties you can see quite considerable gaps between the percentage of males and females with a Ph.D. In only two counties in Ireland does the number of females with a Ph.D. outnumber males - Monaghan and Offaly. In all other counties - there are more males, this is most pronounced in Dublin where 0.95% of males have a Ph.D., and 0.51% females have one. Incredibly (to me) almost one percent of the adult male population in Dublin holds a Ph.D. The actual numbers are 4,147 out of 440,432 adult males living in Dublin in 2011. I would never have guessed this figure. Compare this with Monaghan where just 0.08% of adult males have a Ph.D. (17 out of 20,717 males). It will be interesting to compare these figures with the 2016 census when they are released.

Note on chart. While I found it easy to plot separate male and female bar charts in R, I could not plot both on the same chart (called a clustered barchart) using barplot function. So it was easier to do in Excel.

Thursday, September 22, 2016

Which is the smartest county in Ireland? #Analytics #HDSDA #101

If the percentage of people in an area who hold a Ph.D. is a measure of how smart a county is, then look no further than the 2011 Census Small Area Population Statistics (SAPS) for details. I downloaded the figures for the overall population of each county, and the numbers of men and women in each county who hold a Ph.D. Of course counties with larger populations will have more Ph.Ds. (Co Dublin had a population of 910,012 of whom 6,573 had a Ph.D. in 2011). So I converted the figures to a percentage in order to make comparisons between the counties. 

The bar chart below (written in R) displays the percentage of the population of each of the 26 counties who have a Ph.D.


While the numbers are small, 0.72% of the population of Dublin (where there are three Universities) has a Ph.D., it is interesting to compare the regions and counties. You can see that the University cities (Dublin, Galway, Cork, and Limerick), plus their surrounding counties (e.g. Wicklow, Kildare, Clare), have much higher levels than midland counties where there is no university. It is also reasonable to assume that where there are Universities, there will be more people with Ph.D. living there because that's where many of them work. I'll do a comparison of males and females for tomorrow.

If you would like to plot this chart for yourself, the R code at the end of this post should work. You'll need to create a CSV file to store the data (I called mine "PhDbyCounty.csv" in the code below) - here's a table of the data I used that you should copy and save into the CSV file:

County Males PhD Female PhD Total PhD Pop Males Pop Females Total Pop (over 19+) Percentage Males Percentage Females Percentage Total
Dublin 4,174 2,399 6,573 440,432 469,580 910,012 0.95 0.51 0.72
Galway 710 416 1,126 86,221 86,569 172,790 0.82 0.48 0.65
Cork 1,333 722 2,055 177,896 180,378 358,274 0.75 0.4 0.57
Carlow 48 42 200 18,730 18,210 36,940 0.26 0.23 0.54
Wicklow 284 155 439 45,376 46,665 92,041 0.63 0.33 0.48
Kildare 397 219 616 67,046 66,361 133,407 0.59 0.33 0.46
Limerick 372 194 566 68,797 68,663 137,460 0.54 0.28 0.41
Clare 183 109 292 40,819 40,170 80,989 0.45 0.27 0.36
Meath 245 145 390 58,561 57,609 116,170 0.42 0.25 0.34
Sligo 79 64 143 22,330 23,055 45,385 0.35 0.28 0.32
Waterford 150 76 226 39,397 40,103 79,500 0.38 0.19 0.28
Westmeath 94 62 156 28,521 28,648 57,169 0.33 0.22 0.27
Kerry 183 69 252 52,962 52,206 105,168 0.35 0.13 0.24
Leitrim 29 18 47 11,052 10,442 21,494 0.26 0.17 0.22
Tipperary 149 93 242 55,296 54,064 109,360 0.27 0.17 0.22
Mayo  117 75 192 46,001 45,096 91,097 0.25 0.17 0.21
Cavan 37 19 90 23,752 22,343 46,095 0.16 0.09 0.2
Louth 106 58 164 39,721 40,841 80,562 0.27 0.14 0.2
Donegal 133 67 200 52,113 52,725 104,838 0.26 0.13 0.19
Longford 30 17 47 12,734 12,263 24,997 0.24 0.14 0.19
Wexford 111 72 183 47,473 47,761 95,234 0.23 0.15 0.19
Roscommon 47 33 80 22,385 21,158 43,543 0.21 0.16 0.18
Kilkenny 57 43 100 31,915 31,453 63,368 0.18 0.14 0.16
Offaly 39 39 78 25,581 25,113 50,694 0.15 0.16 0.15
Laoighis 37 24 61 24,773 23,428 48,201 0.15 0.1 0.13
Monaghan 17 21 38 20,717 19,983 40,700 0.08 0.11 0.09


# R code to plot bar chart
#
# read in and display PhD data from CSV file
PhDdata <- hdbycounty.csv="" header="T)</font" read.csv="" sep=",">
#
# Check input is read correctly: display some data from CSV file
names (PhDdata)
PhDdata$County
PhDdata$Percentage.Total
#
# Plot bar chart
barplot(PhDdata$Percentage.Total, horiz = TRUE, 
        names.arg = PhDdata$County, xlab = "Percent Population with a PhD",
        main = "Proportion of PhD by County in Republic of Ireland",
       col = "red", space=0.5, axisnames=TRUE, cex.names = 0.75, las=1)
# end of code

Wednesday, September 21, 2016

Some things you might not know about data. #Analytics #HDSDA #102

Statistics can be a confusing subject at the best of times - there are so many different formulas and test statistics (t, F, r, H, s, U, etc) that it can be difficult for students to figure out what's what, and what they are used for. The simplest of all descriptive statistics is the average. Everyone knows that to calculate the average of a series of numbers that all you have to do is to add them up and divide by the number of values. Or is it?

Averages are measures of Central Tendency, and there are in fact three flavours of averages: the mean, the median, and the mode. Each of these gives us similar, but different types of descriptive information about data. Most of the time when we talk about an average value we are in fact talking about the mean. Microsoft Excel confuses this a bit further - if you want to use Excel to calculate the mean, you use the "average()" function.

Let's take a look at a simple set of data showing the annual salaries of five people:

Name    Salary
John    €25,000
Mary    €27,500
Mike   €112,000
Jane    €34,500
Hugh    €48,750

To calculate the mean, this is simply:

(€25,000 + €27,500 + €112,000 + €34,500 + +€48,750) / 5 = €49,550

So, the mean salary is €49,550. While this is a useful metric for these data, you will have noticed that one of the values (Mike/€112,000) is way bigger than all the others, which tells us that our data are skewed (Skewness is another descriptive statistic). Our mean value is greater than four out of the five values given, and consequently has limited value as a measure of central tendency in describing this dataset.

The median is also an average, but of a different kind. It is the mid-point of a set of scores. To determine what the median is we simply rank the scores and point out the middle value. Let's do this for the salary data above:

Name    Salary
Mike   €112,000
Hugh    €48,750
Jane    €34,500
Mary    €27,500
John    €25,000

Jane's salary of €34,500 is the median - a much different statistic compared to our mean value of €49,550. The median is much less sensitive to extreme values, and when you have extreme values the median is a better representation of central tendency than the mean. For example, in our data above - if Mike's salary was reduced to €50,000, the median would still be €34,500 (Jane), but the mean value would change (to €37,150). If there are an even number of values, take the mean of the two middle values to determine the median.

Finally, the mode is a third useful average - this is the value that occurs most frequently in our data. If you examine the data above, each value occurs only one, so there is no mode. So let's take a look at a different set of values:

Sample data: 6, 5, 7, 4, 6, 8, 7, 7, 3, 7

Here you can see that the value "7" occurs four times in this data set - therefore the mode is 7, (for these data the mean = 6, and the median = 6.5). As data analysts we need to be sure of our terminology and distinguish between the mean and an average. We also need to describe data with more than just the mean, because it can be misleading if the data are skewed (as in salary example above).

If the mean, the median, and the mode are close together in value you can usually assume that the data are normally distributed around the mean, and would appear like a bell curve in a frequency histogram.

If you would like to determine how to calculate the mean, median, and mode using Excel - check out my YouTube video below:

Tuesday, September 20, 2016

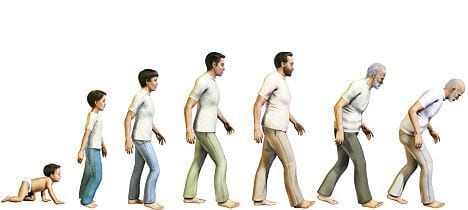
The Seven Stages of Man - Shit, I'm at stage 5! #roundbelly #103

At a Faulty Development event recently we had a very interesting session on identity where Shakespeare's As You Like It was quoted to show how people's identity changes over time. As You Like It was on the Intermediate (now Junior) Certificate English syllabus when I sat the exam in 1975 - I remembered nothing from it. I'm sure that like most people, I recognised myself in the seven stages straight away. At first I giggled at this, and then I thought a bit more seriously about it.

Image source: No Sweat Shakespeare.
First - what a wonder that William Shakespeare's words are being quoted over 400 years after they were written, and how appropriate they still are. I figure I am at stage 5, at times I feel as if I am pushing stage 6. At stage 5 "man" is middle-aged. He is "wise" and contributes to society, with his "round belly" he enjoys the finer things in life like good food and wine.

Later today I will have my first class of the new academic year with second-year students. I'm guessing that most of them will be in the 19 to 20 age group. To them I will appear old, and I will feel the 36-37 year gap in our ages. I'm probably even older than many of their Dads.

As Michael D. Higgins said during the 2011 Presidential Election: "There's nothing I can do about my age", neither can I. It's interesting that we can be bracketed so easily into an identity, and age is the most obvious manifesto of this. A few years ago I gave up trying to be "young" and "hip" in classes with younger students, and just got on with being me. While age can convey a sense of knowledge and experience, there's no denying that there will be a gap in the classroom stage today that I will do my best to minimise.

For reference - here's Shakepeare's As You Like It (Act 2 Scene 7) where Jaques talks through the "seven ages of man":

All the world's a stage,
And all the men and women merely players;
They have their exits and their entrances,
And one man in his time plays many parts,
His acts being seven ages. At first the infant,
Mewling and puking in the nurse's arms.
Then, the whining school-boy with his satchel
And shining morning face, creeping like snail
Unwillingly to school. And then the lover,
Sighing like furnace, with a woeful ballad
Made to his mistress' eyebrow. Then, a soldier,
Full of strange oaths, and bearded like the pard,
Jealous in honour, sudden, and quick in quarrel,
Seeking the bubble reputation
Even in the cannon's mouth. And then, the justice,
In fair round belly, with a good capon lined,
With eyes severe, and beard of formal cut,
Full of wise saws, and modern instances,
And so he plays his part. The sixth age shifts
Into the lean and slippered pantaloon,
With spectacles on nose and pouch on side,
His youthful hose, well saved, a world too wide
For his shrunk shank, and his big manly voice,
Turning again toward childish treble, pipes
And whistles in his sound. Last scene of all,
That ends this strange eventful history,
Is second childishness and mere oblivion,
Sans teeth, sans eyes, sans taste, sans everything.

Source: "All the World's a Stage" (Wikipedia)

Monday, September 19, 2016

First Day of New Academic Year, and Climbing a Mountain #104

In August of 2009 I wrote a blog post about climbing Croagh Patrick in Co Mayo, and compared it to the experience of first-year students going to College. Given that today is the first full day of the 2016/2017 academic year I thought I would reproduce it here in full.


While climbing Croagh Patrick last Saturday I had plenty of time to think - and I did, about lots of things. I am heading back into my eight academic year in NCI and will once again have first-year students for a Technology Fundamentals module. I was thinking about what an adventure going to College must be for new students. Also, my daughter Kate is going to Trinity next month to read Natural Science - of course, this reminded me of 31 years ago when I was about to embark on the same adventure in October 1978. So I started to think about the similarities between climbing a mountain for the first time and going to College.

I set out with lots of enthusiasm to climb Croagh Patrick - from the bottom it looks like the picture above - easy? College too is easy - right? I bought a walking stick because I figured I might need to lean on it along the way. Lots of people did not bother with walking sticks - I guess they figured they would not need any help. Students don't get sticks when they enter College, but they do need help along the way.

Within 100m I was almost out of breath and was already wondering how I was going to make it to the top (or the end of the year). I had to rethink my strategy and slow down - rushing into anything (climbing mountains/going to College) is not a good idea. There were lots of other people (fellow students) on the mountain who were equipped differently. There were the "professional" mountain climbers (star students who find College easy) with the right boots, gear, Alpine walking sticks, and energy bars. There were people like me - wearing the only boots I had, carrying a backpack with a camera, a jumper that I did not use, a wind-cheater, and water. I had had lots of advice (as students get from teachers and parents) on what to bring. There were people totally unprepared for a mountain - light T-shirts, sandals, no water, even some people wearing Wellingtons, all sorts - just like College. Some people do it the hard way - even in bare feet, but all have a common goal - to get to the top.

After a while I got into a rhythm and routine as I got used to the mountain. Some parts were steeper than others - in College, some subjects are easier than others. Now I started to open up to other mountain climbers who were going up with me, stopping for rests, and of course coming down. Lots of banter about the climb - "only 10k more to the top", "what time is the next bus?", and "is there an elevator here?" Making friends on the mountain was getting easier - we were all in the same boat, and feeling the same sore muscles, and the same determination to get to the top (like making it through to the end of the year and passing your exams). Some people passed me out - I guessed they had done the mountain before (2nd years). Some were actually running up and down the mountains as if they knew where the best footholds were for every step - they must be third or fourth-year students, or graduates. They made it look easy.

Some people were struggling - stopping for rests, looking longingly back at the bottom, or deciding that the mountain was too tough after all. Students drop out of College for all sorts of reasons, people set out to climb a mountain and not make it to the top - College and mountains are not for everybody. What I did see was others urging their companions to keep going. Some were pulling and pushing, offering hands - lots of parents were carrying jumpers and coats for their kids. There was lots of advice - "lean forward", "slow down", "drink some water", and "keep going". It could have related to studies instead of mountain climbing - "get your head into the books", "eat properly", and "keep going". The tougher the climb became, the more I listened to the advice. Advice for first years anyone?

There are lots of small pitfalls - stepping on sharp stones, slipping backwards, somebody getting in your way. Students miss lectures, forget assignments, fail continuous assessments - but the important thing is to keep going. Nobody said mountains or College were going to be easy every step of the way. Expect setbacks - you will not be disappointed. But there are also lots of places to take a rest and take on some refreshments (student bars - in my case The Lincoln Inn). We all need this or we will certainly exhaust ourselves on our respective paths. As Stephen Covey wrote - "sharpen the saw".

Near the top, you call upon all your resilience and recently gathered experience to take on the final part (exams). You have made it this far and there can be no turning back. On Croagh Patrick the hardest part was the last bit - just like exams. Then you're there - at the summit. Exhausted. Thirsty. Exhilarated. You look around and everyone else looks the same - just like your fellow students after the last exam is over. Everywhere there are cameras and smiles. Some people who look like they have just been out for a morning stroll are posing for official looking photos - they must be graduating. You are glad to have made it to the summit at the first time of asking. You look around, but already some of the people who climbed to the top with you are already on their way back down. Absorb the moment - summer is waiting and next year is just around the corner. You have been to the mountain top - enjoy!

You look back down the mountain and take in the view. You can see a whole lot more at the top than you could at the bottom - like knowing a lot more at the end of the year than at the start. The path from the bottom to the top looks a lot easier from here - the stones you tripped on, the gravel you slipped on, the steep parts, are forgotten memories. You have been to the mountain top and you know that you can do it again.

Heading back down of course is a lot easier than coming up the mountain. Some people are racing down the mountain. Are they trying to reach the bottom before you? Will all the jobs be gone when I get to the bottom? You don't know what's at the bottom, but you know you have to reach it. You know you will have to come back up again, so you notice more on the way down than you did on the way up. There was a easier way past a certain obstacle, there's a view you didn't see on the way up - you stop and absorb the sights, you even offer advice to those still on the way up. You have been to the mountain top, and you are ready for more.

It then seems like seconds have passed and you are suddenly at the bottom. You look back up at the top and despite aching muscles you will have an inner pride in your achievement. The mountain looks a lot smaller than when you set out. You know that you can do it again, second year suddenly looks a lot easier. You have been to the mountain top, first year is over.

Sunday, September 18, 2016

Keep on blogging #105

Image source: Pants in a Can.
In my quest to write a blog post every day during 2016, I have reached a small milestone today as this is my 262nd post this year. This equals the amount for the whole of 2011 which was my most productive year ever. That year I was entered into the Irish Blog Awards and felt that I should blog a lot more to get a bit more attention (it didn't work - I didn't win!). 

So - I have 104 more posts to go and it is getting harder to keep the habit up on a daily basis. Some days (like today) I find it very difficult to think of something to write about - hence this post about blogging after observing that it would equal my output from five years ago with still just over three months to go in 2016. Tomorrow is the start of a new academic year - my 14th since joining NCI part time in November 2002. This will give me some fuel for new posts about the new academic year and how much I am looking forward to it. 

Saturday, September 17, 2016

Whinging Senators and GAA Tickets #106

Fine Gael Senators Michelle Mulherin and Catherine Noone (both from Mayo) put their feet in it this week by moaning about not getting All-Ireland tickets for tomorrow's big game between Mayo and Dublin. Their sense of entitlement did not match their sense of publicity, and both looks like the fools they are because of it.

From last year's pulsating All-Ireland drawn semi-final between Dublin and Mayo.
Tickets for tomorrow are like hen's teeth - it seems they can't be got unless you have connections or a pile of money. There are two tickets for the Davin Stand (lower) for sale on eBay this morning priced at a whopping €840 - these are by no means the best seats in the house (no - I'm not buying!). I even entered a competition on Facebook, for the first time ever, to try to win tickets (no - I didn't win!).

Getting to almost any GAA game in the country is easy enough - apart from the two All-Ireland Finals. Tickets are always available on-line - I buy them from gaa.tickets.ie. But tickets for the final are never on-line (apart from the likes of eBay). Some people moan that they go to all the games, but can't get tickets for the final. One Facebook user this week called it "laughable" that so many people claim to go to all the games. You can buy season tickets that give you preference for final tickets if your county makes it there - for Dublin, this only entitles you to stand on Hill 16. I am one of those people who bemoan the fact that I cannot get a ticket having been to so many games this year - here's the evidence from my tickets.ie account:


That's a total of €440 spent going to Croke Park since the Allianz League Semi-finals back in April. However, I do not think that I should get a final ticket ahead of anyone else - there's no entitlement to this. Even if somebody who has not been to any game this year gets a ticket, nothing gives me preference over that person. There's four and a half million people in this country, but only 82,000 tickets - so that's a lot of people who can't go. Whether you are a senator or a simple fan like me - suck it up that you are not entitled to anything, and go and enjoy it on the telly. I will.

Friday, September 16, 2016

Book Launch: "The Million €uro Decision" by Paul Mooney #107

Last evening I attended the launch of a new book by Dr Paul Mooney which is about education disadvantage in Ireland. Paul is a former President of the National College of Ireland and it was great to welcome him back to the Kelly Theatre, and also get a signed copy of his book. I look forward to reading it fully, one of the credits on the back cover advises that this book "should be made compulsory reading for everyone working in the education system". The book was launched by Seán O'Rourke from RTÉ, who gave an entertaining introduction to the book and his memories of Paul Mooney.
Image source: Amazon.

Ever since I went to Trinity in 1978 there were people like Joe Duffy (also a student in Trinity at that time) who highlighted the divide where in some communities 95%+ of Leaving Cert students go on to College, while in other communities less than 5% do so. It's an old story that will drag on in the education system in this country so long as there are poor and rich people. Paul Mooney is a shining example of how someone can change their lives through education by first qualifying as a master butcher as a young man, then later coming to the National College of Ireland to get a degree, and followed this with a PhD in Trinity. While he would never say something like "if I can do it, how tough can it be", he is an example for others to follow. He came from a generation and a community (Cabra in North Dublin) where most boys his age did not go to College. The first question Mooney asks in this book is "Is this a real problem that needs to be addressed?". The answer, of course that it does need to be addressed - and I'm looking forward to reading how Mooney addresses this in the book. 

The book also has vignettes from people for whom education changed their lives - several were at the book launch last evening. I particularly like one story from a former student of mine who overcame many difficulties to first get a BA degree, and then a Masters. 

The book is published by The Liffey Press and proceeds are being donated to the Fr Peter McVerry Trust.

Dr Paul Mooney speaking at the launch of his book in the Kelly Theatre at NCI.

Thursday, September 15, 2016

Teaching vs Research at Third Level #108

Recently in my department at the College we were asked to provide details of all publications from the past year - I was (at first) slightly embarrassed to respond that I had no academic publications in the past 12 months, nor in the previous 12 months either. Research output is often a measure of academic performance - thankfully it is not in my case. I don't have any research students, and am not involved in any research projects in the College. In most Colleges and Universities it would be considered unacceptable for an academic not to publish his/her research on a regular basis, and it would be even more unacceptable not to do any research at all.

In the past year I have published a new book Exploring Northern Ireland's Causeway and Mourne Coastal Routes, and updated/re-published Exploring Ireland's Wild Atlantic Way. Of course neither of these are academic publications, nor are the 298 blog posts I've made in the past 12 months. I did present at one conference before the summer, but only abstracts were required for this. So no academic output from me - is this bad? Instead of research I concentrate on teaching - that, along with a mountain of administration work, is what most of my work is about.
Image source: Yale Teaching Centre.

Recent research by some Trinity academics reports that "Improving Teaching Has No Impact on Research and Knowledge Transfer". The report suggest that improving teaching efficiency has no effect on improving research, but that improving research efficiency within an institution will "improve its knowledge-transfer efficiency", ie teaching. However, one of the authors of the study, Professor Brian Lucey, is quoted as saying “The evidence is clear that a ‘one size fits all’ approach to higher education institutions’ missions is not appropriate. There is a strong case for specialised research and knowledge transfer-orientated institutions and for teaching-orientated institutions”. So there is room for concentration on teaching and hopefully no shame or embarrassment for those of us who are not researchers.

Wednesday, September 14, 2016

Is it worth getting a degree in Computer Science? #109

With final timetables published today I'm getting a real sense and excitement about the new semester which starts next Monday. Similar to last year, I will have Higher Certificate in Computing (level 6) students, BSc in Computing (level 8), BSc in Technology Management (level 8), and Higher Diploma in Data Analytics (level 8) students this year. Students come to College for many different reasons, but in the end the outcome is the same - a precious degree/diploma/certificate in your fist at Graduation. So is it worth having a degree? Especially in an IT discipline?

Image source: AMP.
A report in yesterday's Irish Independent "Meet the Irish teenager who just landed a €55k job weeks after leaving school", shows that it is possible to get a great job even if you are just 18 years old and don't have a degree. Obviously this is the exception rather than the rule, but it does throw into question if a degree is worth it or needed to get a job. Dr Eamon Costello of DCU recently asked this question on Linkedin. While pointing out that there are billionaire College dropouts, he does record that those "without a degree will not make it to interview stage" in most cases in a job application. He further states that those "with a degree earn more and are less likely to be unemployed over their career" - the evidence points towards a probable better future if you have a degree.

A degree of any type does not guarantee a successful future. An IT degree does not mean you will end up a billionaire. But the signs today are good for graduates, and I hope that all who are starting or continuing on degree programmes next week at NCI or any other College will get what they want from earning a degree. Ultimately it is a badge of achievement that nobody can take away from you, but it how you use it that counts.

Tuesday, September 13, 2016

30th Wedding Anniversary Today #110

On September 13th 1986 in St Patrick's Church, Newport, Co Mayo, I was wed to Roma Bourke from Castlebar. Best thing I ever did. 


Below is a link to a radio request (hosted on Audioboo) sent into RTÉ One's Val Joyce Show on the day by Roma's cousin Anne-Elizabeth Bourke.

Monday, September 12, 2016

More Family Archives from Irish Genealogy #Byrne #Cullen #111

Irish Genealogy is proving to be a treasure trove of ancestral information. Yesterday I found details about my paternal grandparents, today I'm taking a look for my maternal grandparents Paddy Byrne and Kathleen Cullen. One of the confusing things about my grandfather is the spelling of his surname - below you can see that his birth was registered as "Burns", but in his marriage registration he in a "Byrne".

First - my grandmother's birth registration. She was born on 14th April, 1911 in Dublin. Her parents were Richard and Annie (nee McCann) Cullen. Richard is listed as a Carpenter by occupation. The document shows that a "Mary Joyce" was "present at birth" in 34 Manor House. The record before and the one after Kathleen's birth are listed as the same - perhaps indicating that they were delivered by a mid-wife.

Click to enlarge.

My grandfather was born in Co Tipperary and his birth registration shows he was born on 20th July 1905. His father was James Burns, a labourer, and his mother was Maggie Cobourne. The registration shows "her mark" - this tells me that she registered the birth herself, but that she was not able to write her name. In the 1911 census she is listed as "Cannot read". The address is given as "Abbeville" which is near Lorrha in Co Tipperary where they lived.

Click to enlarge.

The marriage registration for Paddy Byrne and Kathleen Cullen shows that they were married on 12th November, 1933 in the Church of the Holy Family on Aughrim Street, Arbour Hill, Dublin. Paddy's surname has changed to Byrne, his father (who was deceased) is also shown as Byrne. His address is given as Villa Park House, Cabra - this area is now a more modern housing estate. His occupation is shown as "Dairying" - we know he was a milkman who delivered milk by horse and cart in Dublin. Kathleen's address is 5 Ashford Cottages, NCR (North Circular Road). This house still exists and can be seen in Google Street View. Interestingly her father, Richard Cullen, is listed as a Plasterer - he was listed as a carpenter when she was born. According to my Mum he was a master plasterer who was a carpenter by hobby. Mum still has some of his woodwork at home in Ballingate. The Best Man was Patrick Cullen - I don't know if he was a relative, Kathleen did not have a brother called Patrick. The bridesmaid was Lily McCarthy who was a neighbour from Ashford Place (later she became my Mum's Godmother). I suspect that the lady to my grandmother's left in the photo above is Lily, the man behind her looks like Richard Cullen, her Dad and my great-grandfather. The marriage ceremony was performed by Ernest Farrell CC, who incidentally was one of the founders of the Catholic Boy Scouts of Ireland in 1927. Paddy and Kathleen Byrne emigrated to Canada in 1957.

Click to enlarge.

Sunday, September 11, 2016

New family records online from Irish Geneology #oloughlin #hurley #112

Searching family history has become very popular with a proliferation of sources of old records and archives. Last week Irish Genealogy published loads of new records that cover births from 1864 to 1915, marriages from 1882 to 1940, and deaths from 1891 to 1965. So I looked them up to see if I could find details for my paternal grandparents PJ O'Loughlin and Kathleen (Hurley) O'Loughlin.

First - I quickly found the birth registration for "Patrick Joseph Loughlin" (note - no "O'") who was born on 22nd December, 1904. His father was Joseph Loughlin, a farmer from Barnacurra (near Newmarket, Co Cork), and his mother was Julia Murphy. Interestingly the birth was registered by a relative Cornelius Murphy also of Barnacurra.

Click to enlarge.

Since the records for deaths cover the year of 1965, his death on 19th June 1965 is also registered. At that time he lived in Cunningham Park in Cornelscourt (listed as Foxrock). He died in St Luke's Hospital in Rathgar from "Generalized reticulum fill (?) sarcoma". His occupation was listed as "livestock salesman".

Click to enlarge.

The record for my grandmother Kathleen (Hurley) O'Loughlin's birth (29th August, 1903) is registered in Newmarket, Co Cork. The registration shows her name as "Kate Theresa" - she was known as "Kattie" while growing up. Her father was Thomas Hurley who is listed as a "Creamery Manager", and her mother was Bridget (Murphy) Hurley. Incidentally, in our family we believe that this Bridget Murphy is related to Julia Murphy making PJ and Kathleen cousins (probably 3rd cousins).

Click to enlarge.

Finally, I also found the record for the marriage of PJ and Kathleen on 23rd January, 1930. He is listed as a "Farmer", while a line is drawn where her occupation should be. They are both listed as being from Newmarket in Co Cork - I don't know when they moved to Carnew in Co Wicklow, but this document indicates that they had not yet moved. Interestingly, granny's name is now listed as "Kathleen". The writing is hard to read, but it looks like they were married in The University Church (on Stephen's Green) in Dublin. The celebrant was her brother Fr Charles Hurley. The bridesmaid was granny's sister Eileen (know to my generation as Auntie Eile or Mrs D). However, the name for granddad's best man is difficult to make out. The first name is Dan - the best I can decipher is that the surname is something like "Mahoney".

Click to enlarge.