Yesterday I attended a presentation from Tableau Software given by their CEO Christian Chabot. The event was packed with not a seat to be spared in the Fitzwilliam Hotel in Dublin. It seemed to me that there were people from all types of backgrounds - some were familiar with Tableau software, while many (like me) were not. I am always interested in seeing new software, but I have heard a lot about Tableau and was curious about the companies policy of making their full software available for free to students, and how it could be used in our Data Analytics programmes.
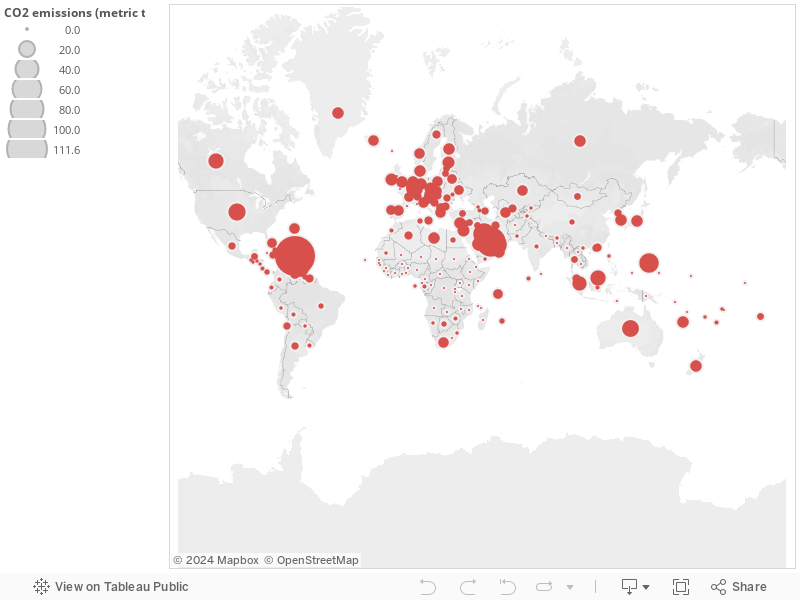
I have to say I was very impressed with the product, demonstrated very well by Chabot who proved, (using Kiva Loans open data) how easy it is to create great visualizations with "Excel level competence". I decided to try this out for myself and within minutes I was able to create my own visualizations with some World Bank data that I often use in class. I was using the free Public version of Tableau which is very easy to learn. This software is very powerful and makes analysing data a lot easier especially for executive focus. As Chabot said to us - "Bye Bye Excel!". You can publish your results to the web - here's my first interactive World map effort showing CO2 emissions (metric tons per capita) for the year 2000 across most countries in the world - this took minutes to create with absolutely no data cleansing or manipulation on my part. The US Virgin Islands has the highest value!
No comments:
Post a Comment