This week I plan to use Tableau Software to get students to create dashboards - we will use Carbon Dioxide data from every country in the world. Tableau Public allows anyone to publish their dashboards online for all to see.
Visualization of data is now big business. The Best Data Visualization Tools of 2016 (by PC Mag) lists Tableau and Microsoft Power BI as the top two tools for big data analysis and intelligence. There is a danger in using such tools without first thinking what you want to show. It is dead easy to open up a data file in Tableau and create interesting charts at the click of a button. But what is the best chart to choose? What are you trying to show? Will people understand what you are showing? Are you making your audience work hard to get value out of your charts? These are the questions we are asking students in our Data Visualization classes at NCI, which we hope to answer by thinking first and plotting second - too often it is the other way around.
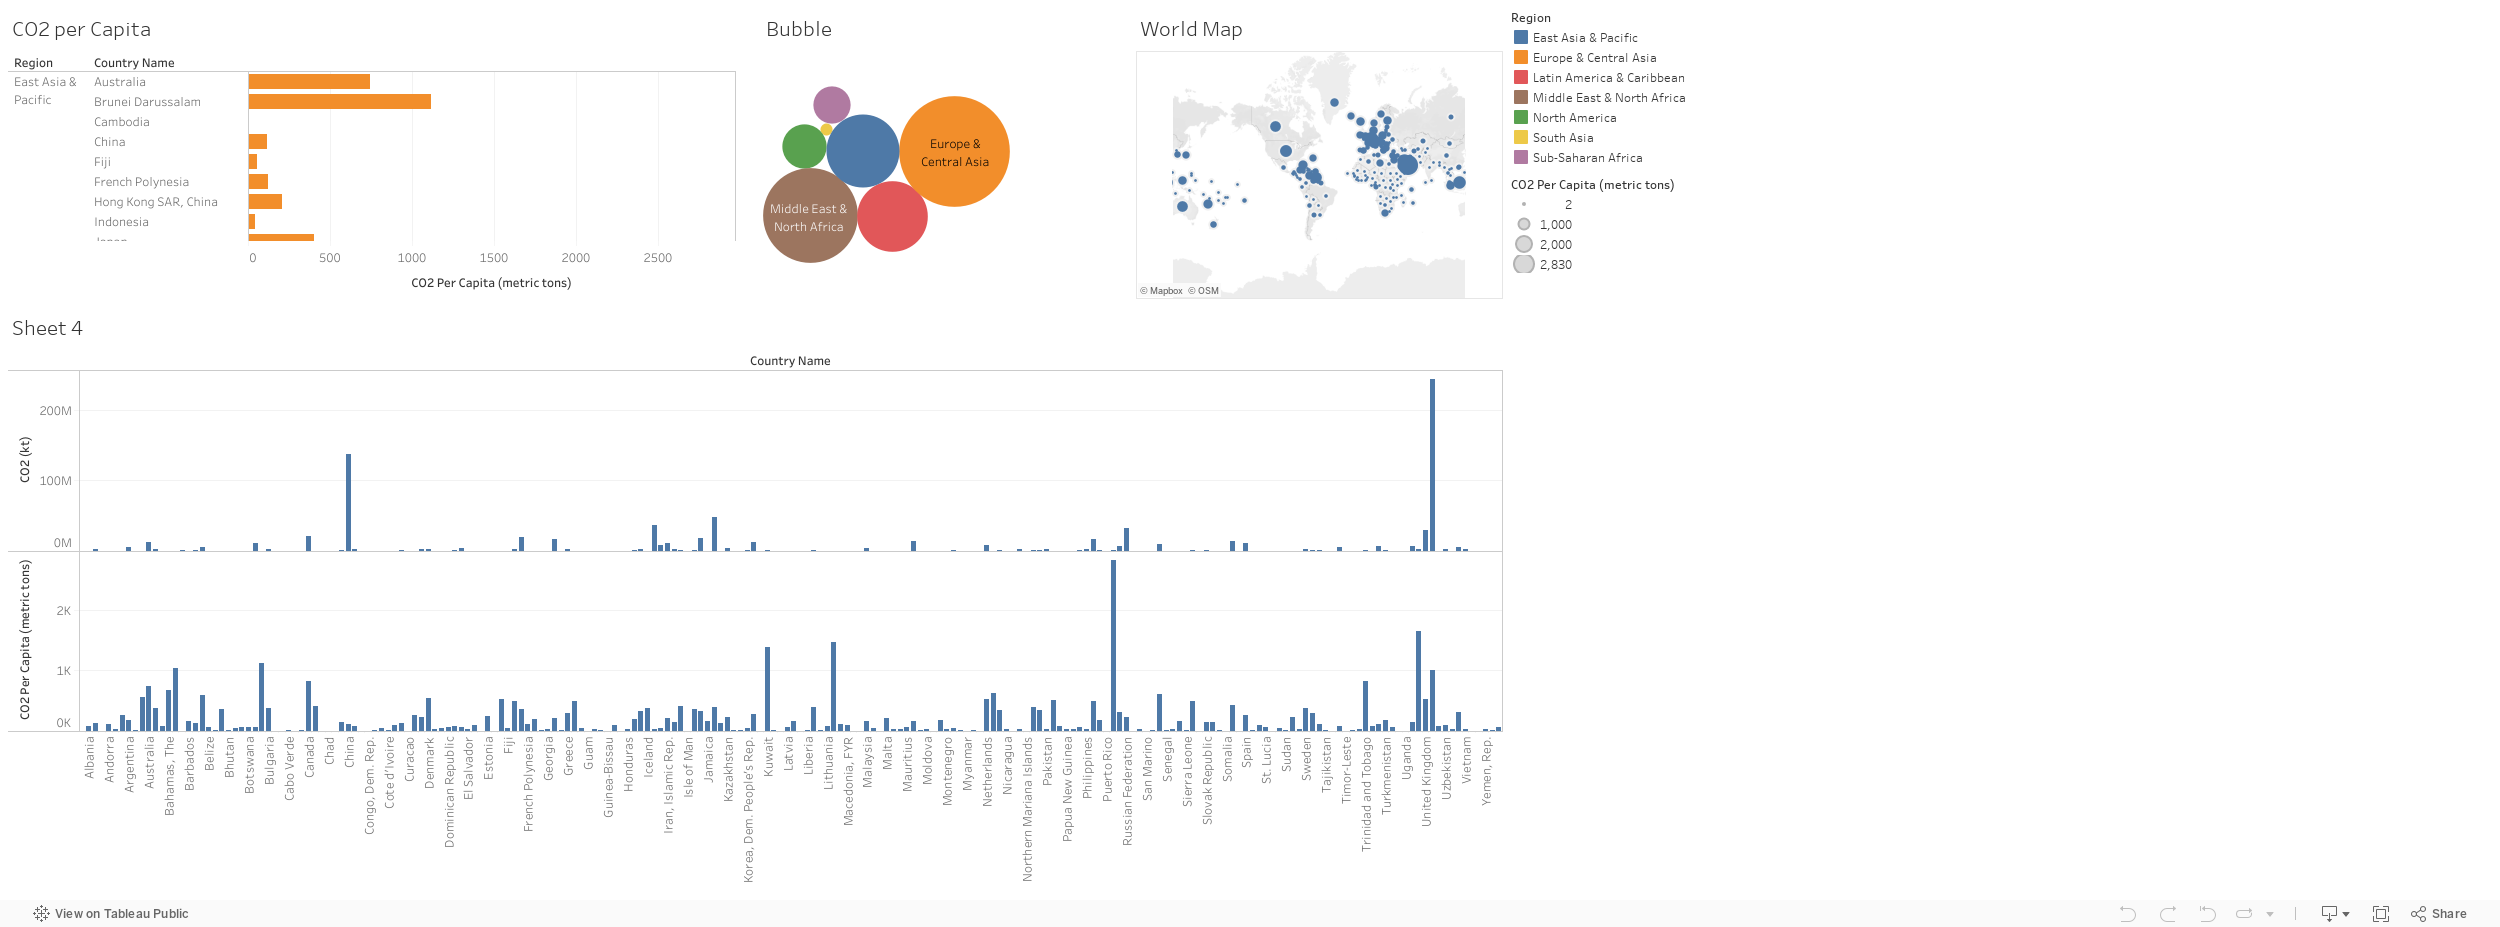
Here's a quick dashboard created in Tableau, only part of the dashboard is visible due to size of blog pane - the full interactive dashboard can be seen here.
No comments:
Post a Comment