Included in the latest version of Tableau Software is a feature that allows you to create maps based on the 26 counties of Ireland. This was not available in previous versions where to use Irish maps you needed a lot of latitude and longitude coordinates. The six counties of Northern Ireland are not included as an Irish county - instead the local authority regions are mapped according to UK maps. Users of Tableau should note that Irish counties are not classified as "Counties" in Tableau's "Geographical Role" - rather they are classified as "State/Province".
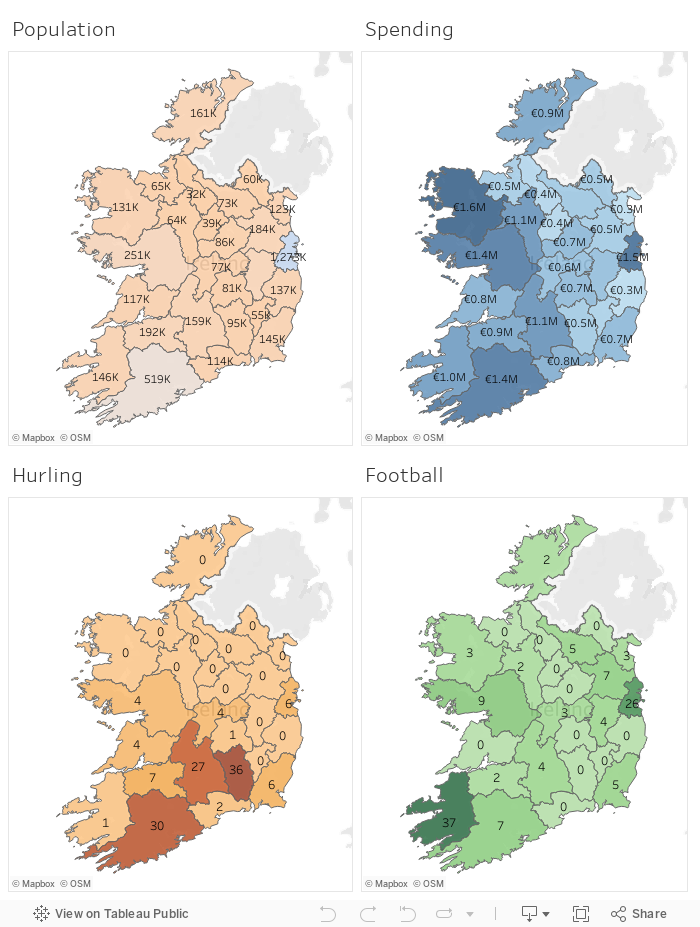
In response to a recent article in the Irish Independent Mayo the big spenders: This graph breaks down each county's costs in 2016, I decided to take a look at how spending compares to success in the senior All-Ireland football and hurling championships. I took the spend data from the Independent article, and the number of titles won by each county (Northern Ireland not included) from Wikipedia. While of course spending in 2015 has nothing to do with winning titles years ago, it does make for interesting viewing when put together in a Dashboard using Tableau. I created a Dashboard showing each county's population, GAA spend, football, and hurling titles. Each map acts as a filter for the other, so go ahead and click on your own county to drill down for detail. The dashboard is published on Tableau Public here.
In response to a recent article in the Irish Independent Mayo the big spenders: This graph breaks down each county's costs in 2016, I decided to take a look at how spending compares to success in the senior All-Ireland football and hurling championships. I took the spend data from the Independent article, and the number of titles won by each county (Northern Ireland not included) from Wikipedia. While of course spending in 2015 has nothing to do with winning titles years ago, it does make for interesting viewing when put together in a Dashboard using Tableau. I created a Dashboard showing each county's population, GAA spend, football, and hurling titles. Each map acts as a filter for the other, so go ahead and click on your own county to drill down for detail. The dashboard is published on Tableau Public here.
No comments:
Post a Comment